dplyr and tidyr for data manipulation.ggplot2.xts and zoo packages for time series data.
4.8/5

4.8/5

4.7/5

4.9/5

4.9/5




Financial Analytics with R benefits from collaborations with leading fintech firms. Partners provide live data feeds for portfolio simulation exercises.












 Placed

 Upskilled

 Career switch

 Upskilled

 Placed
 Upskilled

 Placed

 Upskilled

 Placed

 Placed

 Placed

 Career switch

 Career switch
 Placed
Upskilled
Career switch
Upskilled
Placed
Upskilled
Placed
Upskilled
Placed
Placed
Placed
Career switch
Career switch
Placed
Upskilled
Career switch
Upskilled
Placed
Upskilled
Placed
Upskilled
Placed
Placed
Placed
Career switch
Career switch
Financial Analytics with R curriculum covers time‑series manipulation and risk metrics. You will build a trading strategy using quantmod and back‑test it on historical data.
dplyr and tidyr for data manipulation.ggplot2.xts and zoo packages for time series data.We empower you with skills that land your dream job.
Financial Analytics with R assessment combines a timed coding quiz and a capstone model report. Scoring above 80% unlocks a personalized feedback session.
Take Free Practice Test
Watch how CAP helped students crack exams and land global jobs.
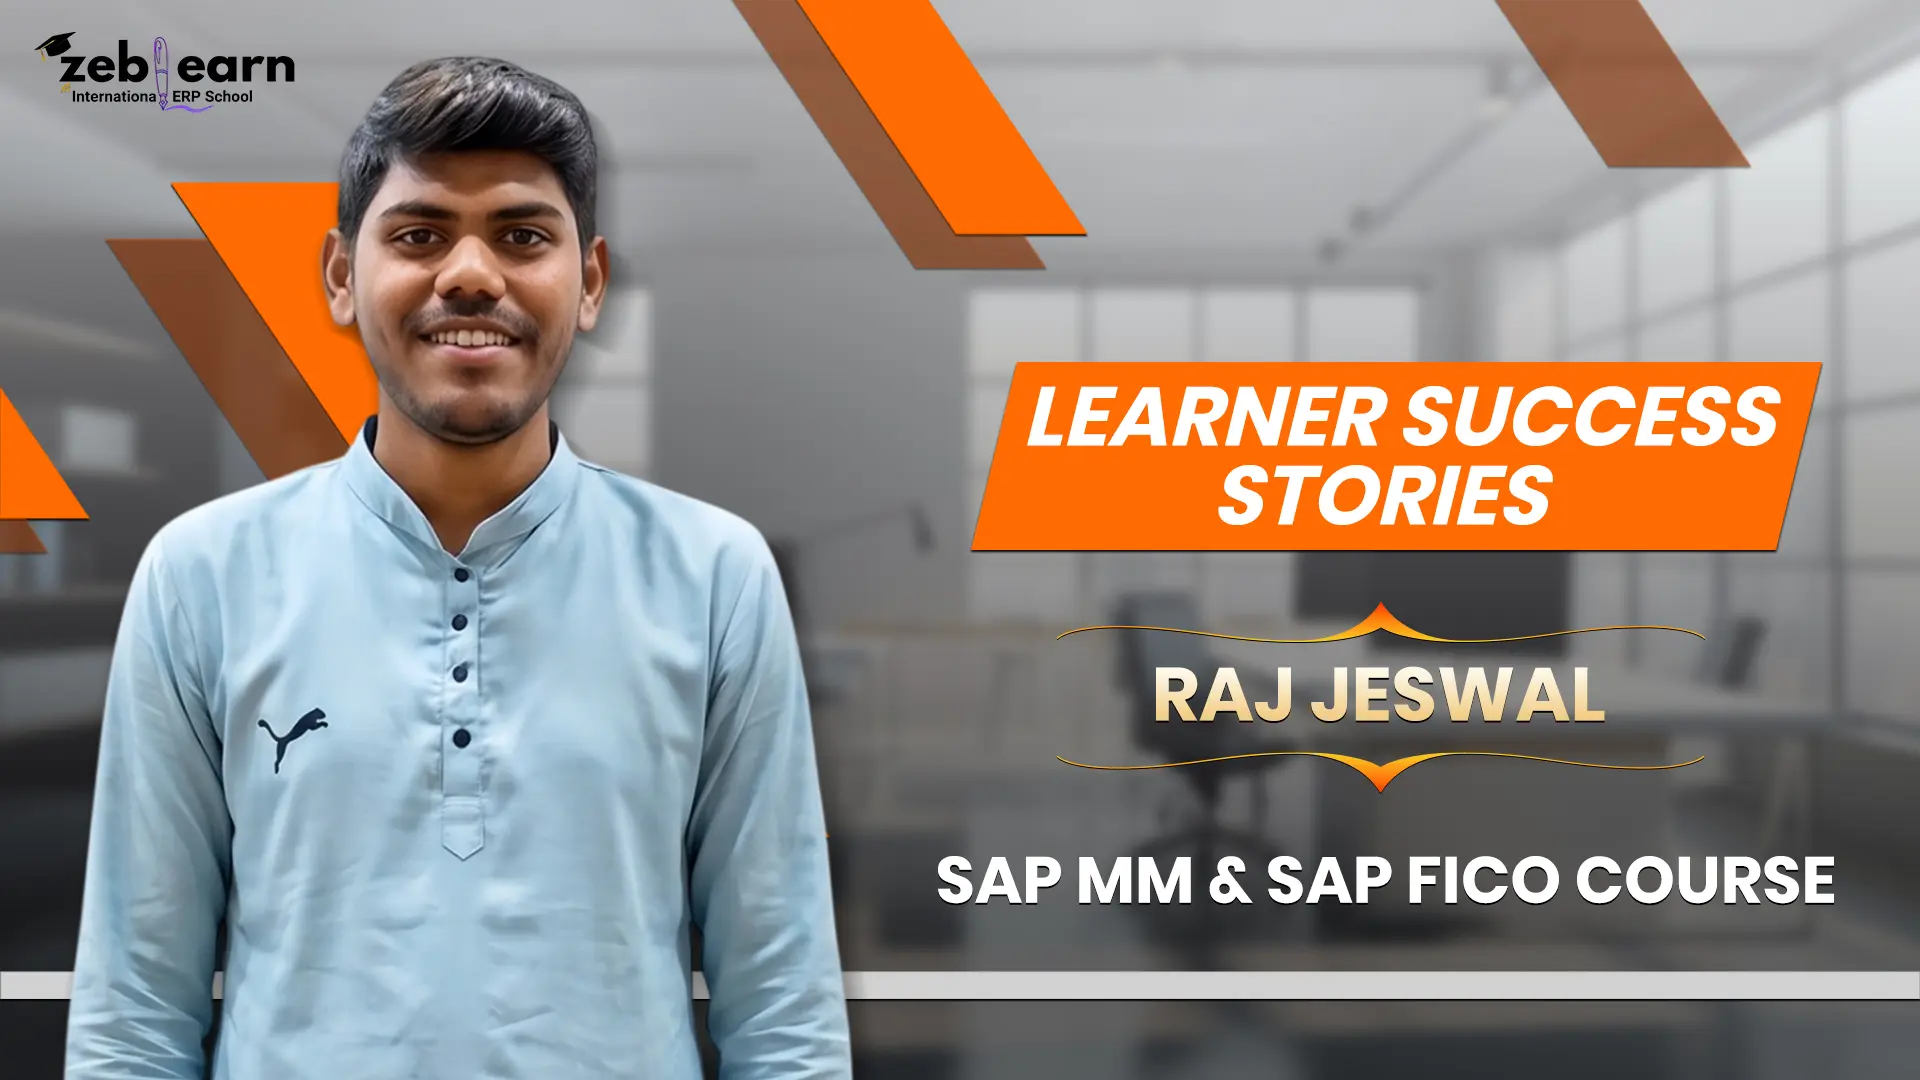
Watch how Zeblearn's programs helped students achieve their professional goals.
Zeblearn is a premier institute offering training in SAP, Workday, Data Science, Full-Stack Development, Salesforce, Machine Learning, Software Testing and more — available both online and in classroom, for students, working professionals and entrepreneurs.


Financial Analytics with R includes exclusive access to a curated library of financial datasets. These resources are updated quarterly to reflect market changes.
Participate in expert-led mock interviews and skill evaluation sessions after program completion.
Lifetime access to LMS with recorded sessions, hands-on practice, and updated learning resources.
Resume building, profile optimization, interview preparation, and placement guidance from industry experts.
Join our live sessions and earn a free certificate. Limited seats available!
Sessions from
| Date | Time IST | Course / Module | Register |
|---|---|---|---|
| Loading upcoming sessions... | |||
| Status | Date | Type | Schedule | Time |
|---|---|---|---|---|
| SOLD OUT | 12 Oct 2026 | Weekend | SAT - SUN (08 Weeks) | 18:00 - 20:00 |
| FILLING FAST | 17 Oct 2026 | Weekday | MON - FRI (08 Weeks) | 08:00 - 10:00 |
| AVAILABLE | 22 Oct 2026 | Weekend | SAT - SUN (08 Weeks) | 10:00 - 12:00 |
₹120,000
₹75,000
You save ₹45,000 Enroll Now, Pay LaterEMI options available · No-cost study now, pay later
Q: What core R packages are taught in a Financial Analytics with R course? A: The course covers quantmod, xts, and PerformanceAnalytics for financial data handling. Q: How does Financial Analytics with R improve portfolio risk assessment? A: It enables calculation of VaR, CVaR, and rolling beta using R's statistical functions. Q: Can beginners use Financial Analytics with R to model time series? A: Yes, the curriculum introduces ARIMA and GARCH modeling with step-by-step R scripts.